Adding tables to Zoom Docs
If you need to stay organized and structured, for example, when working on project management information, you can use the table feature to help you manage your tasks. Whether you're starting from scratch or importing from another spreadsheet, you can use tables to provide an effective way to manage your tasks.
Requirements for using Zoom Docs tables
- Basic, Pro, Pro Plus, Business, Business Plus, Education, or Enterprise account
- Zoom desktop app for Windows, macOS, or Linux: 6.1.6 or higher
- Zoom mobile app for Android or iOS: 6.1.6 or higher
- Zoom Docs enabled by admin
How to create a basic table in Zoom Docs
You can create a basic table to provide a basic organization of data without analytical functions.

- Create your document.
- In an empty line, type / from the Slash menu or from the text editor toolbar click the plus icon +, then select Table.
A table with 3 columns and 3 rows will be displayed. - (Optional) Hover over the table, click the drag icon
 , and select Convert to Data Table to upgrade the basic table to a data table.
Manage a cell
- Click within a cell to add or remove content to it.
Manage a row

- Click a row, then click one of the following:
- The merge cells icon to merge or split cells within the row.
The cell colors icon to color the row. - The text alignment icon to align the text in the row.
- The trash icon to delete the row.
- The comment icon to leave a comment.
Manage a column

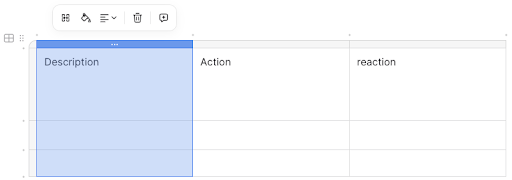
- Click a column, then click one of the following:
- The merge cells icon to merge or split cells within the column.
- The cell colors icon to color the column.
- The text alignment icon to align the text in the column.
- The trash icon to delete the column.
- The comment icon to leave a comment.
Manage the entire basic table

- To the top left of the table, click the drag icon
 to move the table.
 - Click the six dots vertical
 to do the following:
- Use AI to help write the content.
- Change the color of the table.
- Distribute the columns.
- Copy the link of the Zoom Docs.
- Comment on the table
- Insert content above the table.
- Insert content below the table.
- Copy the table.
- Delete the table.
How to create a Data table in Zoom Docs
You can create a data table to collect, organize, and track data, making it useful for project management, task and progress tracking, and managing various data assets.

- Create your document.
- In an empty line, type / from the Slash menu or from the text editor toolbar click the plus icon +, then select Data table.
A table with 3 columns and 3 rows will be displayed.
Note: Make sure there’s no empty space or indentation on that line. - (Optional) Hover over the table, click the drag icon
 , and select Convert to Table to simplify the data table to a basic table.
Manage a cell
Click within a cell to add or remove content to it.
Manage a row
To manage a row, do the following:
- To the left of the row, click the six dots vertical
 or check its number, to expand it, add a comment, duplicate it, delete it, etc.
 - At the bottom of the last row, click the plus icon to add a new row.
Manage a column
To manage a column, do the following:
- Select a column.
- Double-click a column header to do the following under:
- Name: Enter a text.
- Type: Select a type such as number, currency, multiple select, formula, date, etc.
- More options: Provide a description and other options.
- Click Save.
- To the right of the column header, click the down arrow
 to edit it, duplicate it, sort it, etc.
 - To the right of the last column, click the plus icon
 to add a new column.
Add a formula to your data table as an example
- Double-click the header of a column of the data table you created.
- Under Type, select Formula.
- Under Formula editor, click the box to edit the formula, then click Save.
- Under More options, add a Description as desired.
- Click Save.
- (Optional) Double-click an empty cell to edit the formula, then click Save.
Note: You can type or select reference columns in the table.
Manage the entire Data table
- To the top left of the table, click the drag icon
 to move the table.
 - Click the six dots vertical
 to do the following:
- Use AI to help write the content.
- Copy the link of the Zoom Docs.
- Insert content above or below the table.
- Comment on the table
- Copy the table.
- Delete the table.
Change the Data table view
- On the top left of the Data table, click the plus icon
 , select one of the following:
- Table view, to display a grid view or list view in a structured, tabular format.
- Board view, to display the data as cards organized into columns, representing different stages of your process.
- Calendar view, to display a calendar to your doc.
- Gallery view, to display galleries to your doc.
- (Optional) On the top of the table, click on the view, then click the more icon
 , then select one of the following:
- Rename: Rename the view.
- Change view to: Change the view to a different view type.
- Copy link to view: Copy the link of the view.
- Duplicate: Duplicate the view.
- Delete: Delete the view.
How to create a table from a spreadsheet
- Open your document in Zoom Docs and your spreadsheet.
- From your spreadsheet, copy the content, then paste it into your document.
A table will be created in your document with the pasted content. - (Optional) On the top left corner of the table, click the six dots vertical
 , to manage it.


